甲府市街地流動のsqliteを使った分析
(2019/03/24改定)
時分割データ
データベースsqlite3を使って、データを一つのDBファイルにし、そこからデータを加工し表示する。
DSは複数のテーブルからなり、ソフトによってデータの格納方法(ディレクトリやファイルの構造)が異なるが、sqliteは一つのファイルにまとめて格納されているので、持ち運びが便利である。
(ただし、ネットワークを通じて複数の人が書き込むことがある場合は排他制御が必要なので、そのような用途には向かない。)
日ごとに、各地点での携帯端末アドレス滞在時間をDBにいれてある。: DBの最新版 ~raspimngr/db/kofu_traveler.sqlite3
テーブル
| テーブル | 内容 |
|---|---|
| traveler | ある地点から別地点への移動データ(~raspberrypiのsummary_kofu/traveler)をそのまま格納 |
| traveler_all | 外付け、内蔵両方のセンサからのデータをマージしたもの |
| flow | 上記から日ごと、時間ごとに地点間(OD)移動数をカウントして値を格納したターブル |
| flow_trunc10 | 上記と同様な形式で、10秒以下の移動を排除したデータ (通常、こちらを用いるのがよい) |
| flow_all | 外付け、内蔵両方のセンサからのデータをマージしたもの |
| flow_all_trunc10 | 〃 |
| holiday | 祝休日と平日に分けて集計する場合のために休日の一覧を格納 |
| sensor | センサーの置き場所、位置 |
- sqlite3では日にちは"YYYY-mm-dd"の形式を用いることに注意。
テーブルの構造
- traveler
| フィールド名 | 型 | Null | 既定値 | PK |
|---|---|---|---|---|
| addr | TEXT | 1 | None | 0 |
| origin | TEXT | 1 | None | 0 |
| destination | TEXT | 1 | None | 0 |
| dDate | TEXT | 1 | None | 0 |
| aDate | TEXT | 1 | None | 0 |
| dTime | TEXT | 1 | None | 0 |
- flow 及び frow_trunc10
| フィールド名 | 型 | Null | 既定値 | PK |
|---|---|---|---|---|
| yearday | TEXT | 1 | None | 0 |
| hour | TEXT | 1 | None | 0 |
| origin | TEXT | 1 | None | 0 |
| destination | TEXT | 1 | None | 0 |
| number | INTEGER | 1 | None | 0 |
| glbit | INTEGER | 1 | None | 0 |
- sensor
| フィールド名 | 型 | Null | 既定値 | PK |
|---|---|---|---|---|
| id | TEXT | 0 | None | 1 |
| lat | REAL | 0 | None | 0 |
| lon | REAL | 0 | None | 0 |
| locationName | TEXT | 1 | None | 0 |
| area | TEXT | 0 | None | 0 |
| shortName | TEXT | 0 | None | 0 |
In [2]:
import csv
import sqlite3
from datetime import datetime as dt
from datetime import timedelta
import pandas as pd

db_file = "kofu.sqlite3" # ファイルの場所はそれぞれの環境に応じて変える
conn = sqlite3.connect(db_file)
cur = conn.cursor()

def query(sql_str):
    cur.execute(sql_str)
    return cur.fetchall()
In [3]:
column_list = ("index","フィールド名", "型", "Null", "既定値", "PK")
flow_table_data = query('PRAGMA TABLE_INFO("sensor")')
flow_structure = pd.DataFrame(flow_table_data, columns=column_list)
print(flow_structure.drop(["index"],axis=1))
In [39]:
result = query('select substr(dTime, 0,3) as t, origin, destination, count(*) as amount from traveler'
      ' where dDate >= "2018-09-01" and t >="20" group by t, origin, destination')
print(result[0:5])
- 8時から20時のデータ抽出
In [40]:
result = query('select substr(dTime, 0,3) as t, origin, destination, count(*) as amount from traveler'
               ' where dDate >= "2018-09-01" and strftime("%w", dDate)%6 =0 and t >"08" and t <= "20" '
               ' group by t, origin, destination')
print(result[0:5])
時間ごと集計データ(flow)からのデータ抽出
- 時間ごと、ODごとに、9月30日のデータを抽出 (地点間移動時間が10秒以内は排除)
In [41]:
# flow data 登録用sqlのテスト
result = query('select substr(dTime, 0,3) as t, origin, destination, count(*) as amount from traveler'
               ' where strftime("%s", time(aTime)) - strftime("%s", time(dTime)) > 10 and '
               ' dDate = "2018-09-30" group by t, origin, destination')
print(result[0:5])
- 20時以降のデータ集計 (すべての日にちの合計)
In [42]:
day_category = "1"
result = query('select origin, destination, sum(number) from flow where `hour` >= "20"'
               + ' and strftime("%w", datetime(yearday)) %6 == ' + day_category
               + ' and origin!=destination group by origin, destination')
print(result[0:10])
各種集計(実用目的)
DB注のO,Dは次のidの数字部分のみで記録されている。(DBのsenorテーブルに入っているので、それを関連付けて出力することも可能)
| id | lat | lon | 地点名 |
|---|---|---|---|
| kofu2 | 35.658933 | 138.571024 | 三枝豆店 |
| kofu3 | 35.660988 | 138.571165 | 風月堂 |
| kofu4 | 35.670632 | 138.565893 | 永田楽器 |
| kofu5 | 35.662019 | 138.571818 | 文化のるつぼ Hechima |
| kofu7 | 35.666474 | 138.567104 | ライフインナカゴミ |
| kofu8 | 35.669087 | 138.566179 | オスカー本社・朝日店 |
| kofu9 | 35.663483 | 138.568223 | 防災新館1F |
| kofu10 | 35.660508 | 138.571015 | 河野スポーツ |
| kofu11 | 35.65898 | 138.569654 | 内藤セイビドー眼鏡店 |
| kofu12 | 35.665457 | 138.567812 | 立ち食い焼肉 鷹の |
| kofu13 | 35.659908 | 138.571535 | ブラザー(文房具) |
| kofu14 | 35.666835 | 138.571457 | 甲州夢小路 |
| kofu16 | 35.662705 | 138.570433 | 甲府クラフトラボ |
| kofu17 | 35.661394 | 138.56881 | ダン珈琲店 |
| kofu18 | 35.662433 | 138.569498 | カフェ・キュイエール |
| kofu19 | 35.660883 | 138.570182 | きぬや |
| kofu20 | 35.66005 | 138.56915 | そば処 奥義 |
| kofu21 | 35.671693 | 138.566729 | 玉屋 |
| kofu22 | 35.665733 | 138.568327 | 奥藤本店 |
| kofu23 | 35.665305 | 138.567282 | 六曜館珈琲店 本店 |
| kofu24 | 35.660092 | 138.570098 | ルパンザバール ワイン酒場前 |
- いくつか特徴的なODごとの流量の時間推移
In [4]:
# DB接続
import sqlite3
import pandas as pd
import matplotlib.pyplot as plt

# 8tops上でのファイル (ファイル名は環境に応じて変更すること)
conn = sqlite3.connect("/home/raspimngr/db/kofu_traveler.sqlite3")
#conn = sqlite3.connect("kofu_traveler.sqlite3")
cur = conn.cursor()

# テーブル名 (flow, flow_trunc10, flow_all_trunc, flow_all, flow_all_trunc10のどれか)
table_name = "flow_trunc10"


# 時間帯別流動数

def plot_hourly_flow(path, sub_title="", filename="temp.png", direction=False, legend_outside=False):
    count_data = {"00": {}, "01":{},"02": {},"03": {},"04": {},"05": {},"06": {},"07": {},"08": {},"09": {},
                 "10": {},"11": {},"12": {},"13": {},"14": {},"15": {},"16": {},"17": {},"18": {},"19": {},
                 "20": {},"21": {},"22": {},"23": {}}
    opt_direction = ""
    for l, pos in path.items():
        if direction:
            opt_direction = ''
        else:
            opt_direction = ' or (origin="' + pos[1] + '" and destination="' + pos[0] + '")'

        sql = ("select hour, sum(number) from " + table_name
               + ' where ((origin="' + pos[0] + '" and destination="' + pos[1] + '")'
               + opt_direction + ")"
               + ' and yearday>="2018-09-01" and yearday<="2019-01-31" '
               + ' group by hour order by hour')
        result = cur.execute(sql).fetchall()
        for v in result:
            count_data[v[0]][l] = v[1]
    df = pd.DataFrame.from_dict(count_data)
    df = df.T
    df = df.reset_index()

    fig = plt.figure( figsize=(8,5))
    ax = fig.add_subplot(1, 1, 1)
    ax = df.plot(ax=ax, fontsize=12, xticks=df.index)
    if legend_outside:
        ax.legend(fontsize=12,loc='center left', bbox_to_anchor=(1.0, 0.5))
    else:
        ax.legend(fontsize=12)
    ax.set_title("時間別移動アドレス数"+sub_title, fontsize=14)
    ax.set_xlabel("時間", fontsize=14)
    ax.set_ylabel("アドレス数", fontsize=14)

    plt.savefig(filename, bbox_inches="tight")
    plt.show()

path = {}
path["奥藤 - 防災新館"] = ["22", "9"]
path["防災新館 - ダン"] = ["9", "17"]
path["ダン - 風月堂"] = ["3", "17"]
path["ブラザー - ルパン"] = ["13", "24"]
path["キュイエール - クラフト"] = ["16", "18"]

plot_hourly_flow(path,"(双方向)","hourlyFlow.svg", legend_outside=True)

In [2]:
# 丸の内地域
path = {}
path["奥藤 -> 防災新館"] = ["22", "9"]
# path["奥藤 - 鷹の"] = ["22", "12"]
path["防災新館 -> 奥藤"] = ["9", "22"]
path["鷹の -> 六曜館"] = ["12", "23"]
path["六曜館 -> 鷹の"] = ["23", "12"]
path["六曜館 -> 防災新館"] = ["23", "9"]
path["防災新館 -> 六曜館"] = ["9", "23"]

#path["防災新館 -> ダン"] = ["9", "17"]
#path["ダン -> 防災新館"] = ["17", "9"]
#path["ダン -> 風月堂"] = ["17", "3"]
#path["風月堂 -> ダン"] = ["3", "17"]
# path["ブラザー - ルパンザ"] = ["13", "24"]
#path["キュイエール - クラフト"] = ["16", "18"]
#path["防災新館 - キュイエール" ] = ["9", "16"]
#path["防災新館 - クラフト" ] = ["9", "16"]
#path["キュイエール - Hechima"] = ["18", "5"]
plot_hourly_flow(path, " (平和通り、一方向)", "hourlyFlow_heiwa.svg",direction=True, legend_outside=True )

In [4]:
path = {}
path["ライフインナカゴミ - オスカー"] = ["7", "8"]
path["オスカー - 永田楽器"] = ["8", "4"]
path["永田楽器 - 玉屋"] = ["4", "21"]
#path["ライフインナカゴミ -> 永田楽器"] = ["7", "4"]

plot_hourly_flow(path, " (北部・朝日町: 双方向)", "hourlyFlow_asahi.svg" )

In [5]:
path = {}
path["クラフトラボ - きぬや"] = ["16", "19"]
path["ダン - きぬや"] = ["17", "19"]
path["風月堂 - きぬや"] = ["3", "19"]
path["きぬや - ルパン"] = ["19", "24"]
path["ルパン - セイビドー"] = ["24", "11"]
path["風月堂 - 河野スポーツ"] = ["3", "10"]
path["河野スポーツ - ブラザー"] = ["10", "13"]
path["河野スポーツ - 三枝豆店"] = ["10", "2"]
plot_hourly_flow(path, " (中央南部: 双方向)", "hourlyFlow_chuo_south.svg")

In [6]:
path = {}

# path["風月堂 -> きぬや"] = ["3", "19"]
# path["きぬや -> 風月堂"] = ["19", "3"]

path["きぬや -> ルパン"] = ["19", "24"]
path["ルパン -> きぬや"] = ["24","19"]

path["ルパン -> ブラザー"] = ["24", "13"]
path["ブラザー -> ルパン"] = ["13", "24"]

# path["風月堂 -> 河野スポーツ"] = ["3", "10"]
# path["河野スポーツ -> 風月堂"] = ["10", "3"]

#path["河野スポーツ -> ブラザー"] = ["10", "13"]
#path["ブラザー -> 河野スポーツ"] = ["13", "10"]

path["ルパン -> 奥義"] = ["24", "20"]
path["奥義 -> ルパン"] = ["20", "24"]

#path["風月堂 -> ブラザー"] = ["3", "13"]
#path["ブラザー -> 風月堂"] = ["13", "3"]

plot_hourly_flow(path, " (銀座通り周辺: 一方向)", "hourlyFlow_ginza.svg", direction=True, legend_outside=True)

In [7]:
path = {}

path["風月堂 -> きぬや"] = ["3", "19"]
path["きぬや -> 風月堂"] = ["19", "3"]

path["風月堂 -> 河野スポーツ"] = ["3", "10"]
path["河野スポーツ -> 風月堂"] = ["10", "3"]

path["風月堂 -> ダン"] = ["3", "17"]
path["ダン -> 風月堂"] = ["17", "3"]

path["風月堂 -> ブラザー"] = ["3", "13"]
path["ブラザー -> 風月堂"] = ["13", "3"]

plot_hourly_flow(path, " (常盤通り周辺: 一方向)", "hourlyFlow_tokiwa.svg", direction=True, legend_outside=True)

In [8]:
path = {}

path["防災新館 -> キュイエール"] = ["9", "18"]
path["キュイエール -> 防災新館"] = ["18", "9"]

path["防災新館 -> クラフトラボ"] = ["9", "16"]
path["クラフトラボ -> 防災新館"] = ["16", "9"]

#path["クラフトラボ -> キュイエール"] = ["16", "18"]
#path["キュイエール -> クラフトラボ"] = ["18", "16"]

#path["クラフトラボ -> 風月堂"] = ["16", "3"]
#path["風月堂 -> クラフトラボ"] = ["3", "16"]

#path["キュイエール -> 風月堂"] = ["18", "3"]
#path["風月堂 -> キュイエール"] = ["3", "18"]

#path["Hechima -> キュイエール"] = ["5", "17"]
#path["キュイエール -> Hechima"] = ["17", "5"]

plot_hourly_flow(path, " (丸の内 - 中央: 一方向)", "hourlyFlow_maru_south.svg", direction=True, legend_outside=True)

In [9]:
path = {}

#path["防災会館 -> キュイエール"] = ["9", "18"]
#path["キュイエール -> 防災新館"] = ["18", "9"]

#path["防災新館 -> クラフトラボ"] = ["9", "16"]
#path["クラフトラボ -> 防災新館"] = ["16", "9"]

path["クラフトラボ -> キュイエール"] = ["16", "18"]
path["キュイエール -> クラフトラボ"] = ["18", "16"]

path["クラフトラボ -> 風月堂"] = ["16", "3"]
path["風月堂 -> クラフトラボ"] = ["3", "16"]

path["キュイエール -> 風月堂"] = ["18", "3"]
path["風月堂 -> キュイエール"] = ["3", "18"]

path["Hechima -> キュイエール"] = ["5", "17"]
path["キュイエール -> Hechima"] = ["17", "5"]

plot_hourly_flow(path, " (中央北部: 一方向)", "hourlyFlow_chuo_north.svg", direction=True, legend_outside=True)

課題:典型的な2地点の移動時間分布を分析 (早期配属課題)
例:防災会館とダン珈琲店の間の移動時間分布
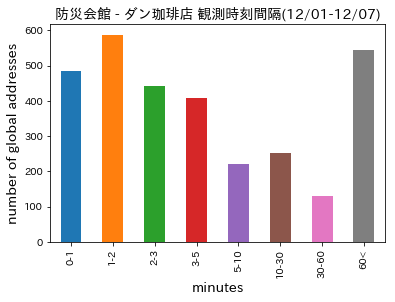
上記は24時間まとめてのデータである。時間帯によって移動時間分布が異なる可能性がある。それを調べてみる。
テスト用スクリプト
In [14]:
# 日にち関数テスト

r = query('select strftime("%w",datetime("2019-02-10"))')
print(int(r[0][0]) % 6)
In [24]:
r = query('select strftime("%s", time("09:00:00")) - strftime("%s", time("10:10:23"))')
print(r[0][0])
データの登録
travelerのデータを読み込んでDBに登録する。
In [ ]:
#!/usr/bin/env python3
# -*- coding: utf-8 -*-

import csv
import sqlite3
from datetime import datetime as dt
from datetime import timedelta

conn = sqlite3.connect("kofu.sqlite3")
cur = conn.cursor()

file_path = "/home/raspimngr/wifi_csv/summary_kofu/traveler/"
file_prefix = "travelerCount_kofu_"

day = "20181001"
eday = "20190131"

# insertを高速に行うためにexecutemanyを使ってみる
l = []
field_str = "(addr, origin, destination, dDate, aDate,dTime, aTime, glBit) "
while day <= eday:
    with open(file_path + file_prefix + day + ".csv") as f:
        reader = csv.reader(f)
        for row in reader:
            # 空白で分割すればよいのだが、他の可能性への対応も残しておく
            dDate = dt.strptime(row[2],"%Y-%m-%d %H:%M:%S")
            aDate = dt.strptime(row[4],"%Y-%m-%d %H:%M:%S")
            dDateStr = dDate.strftime("%Y-%m-%d")
            aDateStr = aDate.strftime("%Y-%m-%d")
            dTime = dDate.strftime("%H:%M:%S")
            aTime = aDate.strftime("%H:%M:%S")
            t = (row[0], row[1], row[3],
                 dDateStr, aDateStr, dTime, aTime, row[5])
            l.append(t)
        cur.executemany('insert into traveler ' + field_str
                        + ' values(?,?,?,?,?,?,?,?)',l)
        conn.commit()
        l = []
    day = dt.strftime(dt.strptime(day,"%Y%m%d") + timedelta(days=1)
                      ,"%Y%m%d")
cur.close()
conn.close()
メモ
つぎのようにviewを作ってあるが、高速にはならない。
create view countTravelers as select dDate as day, substr(dTime, 0, 3) as t,
 origin,destination, count(*) as amount from traveler
 group by dDate, t, origin, destination