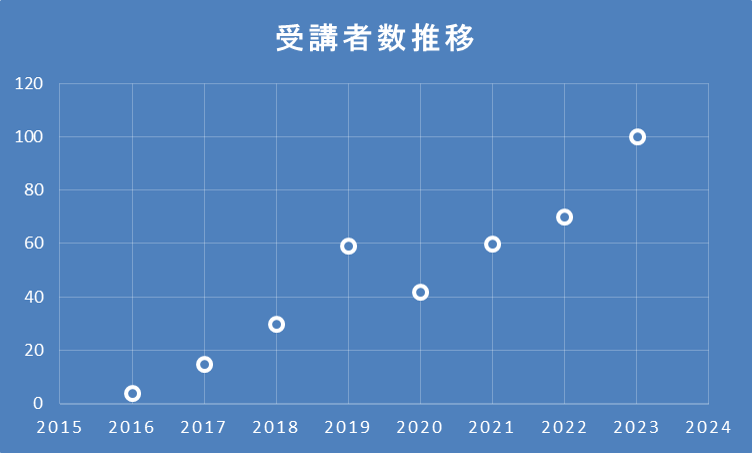
That's the problem.
この授業を組み立てるに当たっての悩みであり解決はしていない。
The subject of the former lecture starting in 2016 was "Numerical Simulation Methods", where I intended to provide some example of numerical models to describe widely-meaning physical systems and the methods to solve the models as well as to find common features among systems.
Through considering what the common (numerical) skills in the graduate course, I have decided to start this "practical data science". This is also reflected the current booming of data science.
The term of "Data Science" has been attracting lots of attention in the last decade.
According to Wikipedia:
an interdisciplinary field that uses scientific methods, processes, algorithms and systems to extract knowledge and insights from structured and unstructured data, and apply knowledge and actionable insights from data across a broad range of application domains. Data science is related to data mining, machine learning and big data.
意訳すれば
科学的手法、アルゴリズム、(具体的な)システムを使って様々なデータから「知識」を抽出する学際的な分野
関連ワード:データマイニング、機械学習、ビッグデータ
Data science is a "concept to unify statistics, data analysis, informatics, and their related methods" in order to "understand and analyze actual phenomena" with data.
データを使って実際の現象を理解、分析
The field encompasses preparing data for analysis, formulating data science problems, analyzing data, developing data-driven solutions, and presenting findings to inform high-level decisions in a broad range of application domains.
分析のためのデータ準備(整理)、データサイエンス的な課題の定式化、分析、データに基づいた解決法の開発、意思決定などに資する
Many statisticians, including Nate Silver, have argued that data science is not a new field, but rather another name for statistics.
多くの統計学(statistics)者は、データサイエンスは新しい分野ではなく、統計学の別名であると主張している。
とはいえ、2000年代以降、"data science"をタイトルに使った学術誌、学術誌の新セクションがいくつか立ち上がった。
機械学習を一つの技術として、様々な分野で用いられるようになっている。
The following research areas have conventionally been using data science methods as essential and necessary tools (They might be termed statistics rather than data science. )
Physics, Chemistry, astronomy and related systems
Fundamental idea (assumption) (天文学、物理学などの近代科学の"信念"): Various phenomena in nature should be understood on the basis of a small number of principles, formula or laws, which are mathematically describable.
There are many objects not necessarily governed by simple principles (Causality logic is not always clear but often left as a black box.), especially in biological, medical and social systems.
The development of computers has facilitated the analysis of such complex systems. We can say that the mathematical and computational framework is Data Sciences.
Recently, the methods of data sciences are applied (exported) to "precise sciences" such as physics, chemstry, etc.
(The number of papers on the analysis of experimental data using machine learning methods is increasing.)
Given the following data, how should you interpret? It's important to set the right context.
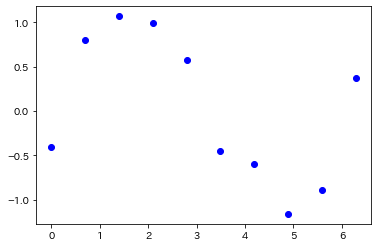
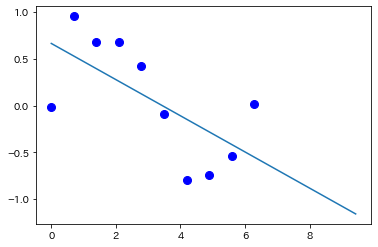
If we have a theoretical conjecture for the object that $y$ is linearly dependent on $x$, you may examine fitting it to $y=ax+b$ by least-square method (linear regression)
In other cases, some other fitting functions would be used, such as polynomials, trig functions, etc.
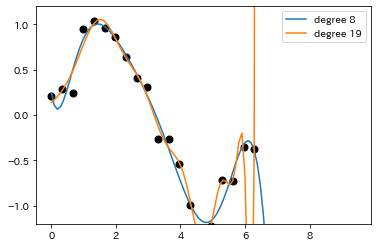
For some intrinsically complex objects such as an economic trend or its prediction, finding the fitting function is not the issue but the problem is to predict the value of $y$ for a given $x$.
Powerful prediction (regression) methods such as "Support Vector Regression" (SVR), which uses "kernel Method". It doesn't assum a fitting function function $y=f(x)$, so we can not get an explicit resultant function to compare the theory (simple principle). That is focusing on getting an excellent prediction. It is also noted that the result includes $x$-dependent probability distribution of $y$.
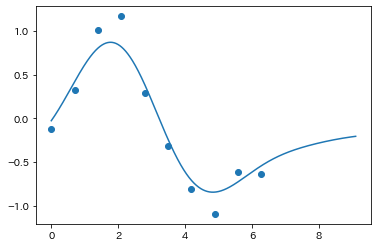
Thus, which method you use is crucial for the conclusion you derive. Therefore, this class is aimed to understand the characteristics of popular computer-aided statistical methods to analyze your experimental or observational data. Due to the term of the lecture being short, it will be focusing only on regression methods. (Another main class of methods is "classification", which is not covered in this class.)
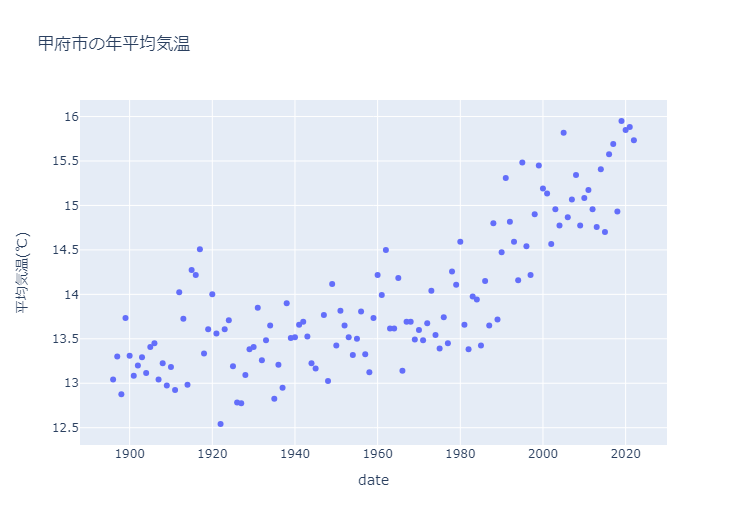
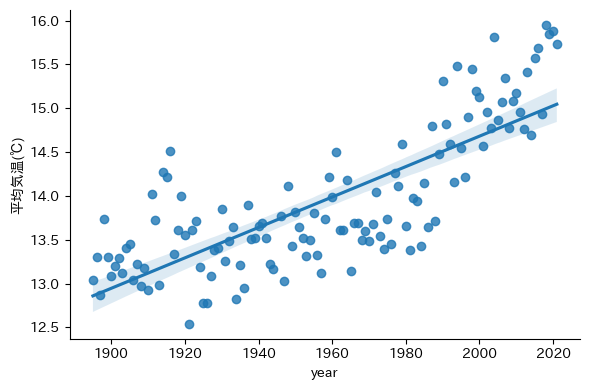
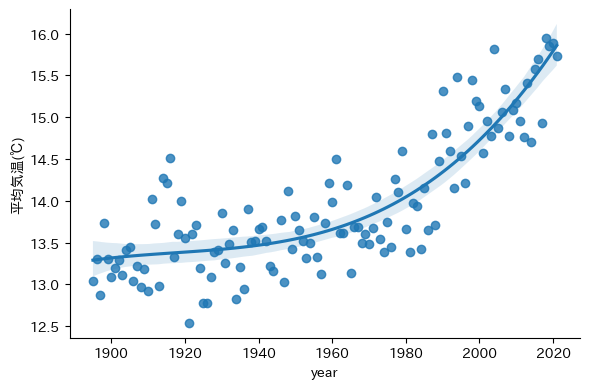
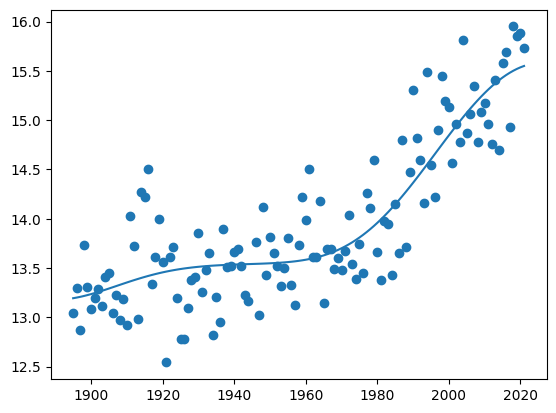
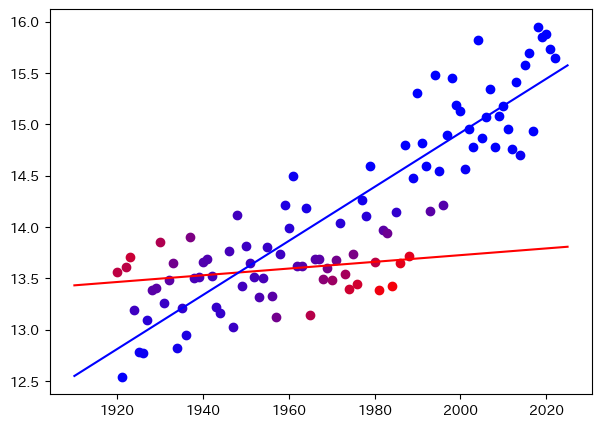
The temperature data of Kofu and its curve fittings. (An example in the pre-lecture: plotted by plotly)
linear fitting (plotted by seaborn)
cf. 気象庁のページ https://www.data.jma.go.jp/cpdinfo/temp/an_jpn.html
non-linear fitting (up to 3rd power)
Support Vector Regression (projecting a curve without assuming a power of function)
Mixed Linear Model (Assuming the data are described by two kind of curves)
Data before 1920 were truncated.
There are students from all courses every year, so their skills and academic history would be spread over a wide range. Therefore,
Simple examples and exercises are provided so that each students can learn based on their own present skills.
Checking the behavior of each methods and exercising on Jupyter Notebook
多様なスキル、履修履歴の学生がいるので、
I have described the text in both Japanese and English so far. At this point, I became aware that most of Web browsers have the function of translation. Probably you can understand the following Japanese texts also in English by using that function.
In the class materials given in the following lecture, I create the text in Japanese except for the comments in python codes, which will be written in English. So, please learn the contents using the translation tools if necessary.