 (copied from Fig. 12.1 of the text1)
http://qiita.com/ssh0/items/20077cb8005e974b3110
Python scripts for percolation simulation is given in this page.
We introduce several geometrical structures constructed by a random process. In this regard, however, we do not treat any dynamical processes but analyse the geometrical specification of constructed structures.
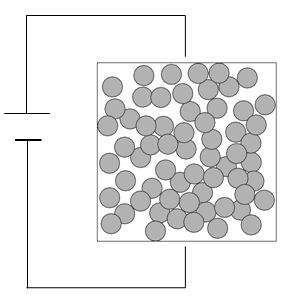
If a container is filled with metall balls shown in the following figure and a battery is connected, the container is an conductor, this is, electric current passes through the system. What parcentage of metal balls is needed for the container to become a conductor? Analysises show the change from the insulator phase to the conductor phase has the sharp shreshold. This is an example of a percolation phase transition.
(copied from Fig. 12.1 of the text1)
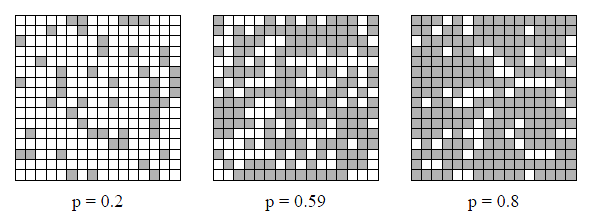
A simpler model is site percolation. The critical density of this problem is analytically found to be 0.59.
 (a copy of Fig.12.3 of the text1)
The program "Cluster.java" is to classify every particles into the clusters using Newman-Ziff algorithm.
Try to run "ClusterApp", and answer the problem 12.7 in the textbook. At first, (a) can be skipped.
http://physics.weber.edu/schroeder/software/demos/IsingModel.html
C \propto |T - T_c|^{-\alpha},\quad M\propto (T_c - T)^\beta, \quad \chi \propto |T - T_c|^{-\gamma}
C(r) = \frac{1}{r^{d-2+\eta}} e^{-r/ \xi }